|
Risk Calculations for Prospective Data
In prospective studies of disease incidence it is possible to go beyond significance testing to tell us whether the differences
between two groups are true differences. We can assess whether these differences are meaningful as well as real. This is possible
through the calculation of relative and attributable risk.
Relative risk (risk ratio, rate ratio, or RR) is the ratio of the incidence in the group exposed to the causal variable
under study (smokers, hypertensives, females, and so on) compared to the incidence in a reference group (nonsmokers, normotensives,
males) not exposed to that variable. Where the variable under study is a preventive method, this is reversed. In that case
it is the ratio of the incidence in the unexposed group compared to the incidence in the exposed group. It can best be thought
of, perhaps, as the ratio of the incidence in the high-risk group to the incidence in the low-risk group. Thus, a relative
risk of 2.5 would mean that persons exposed to the factor were two-and-one-half times as likely to develop the disease as
those not exposed to the factor.
Attributable risk is the incidence in the high-risk group minus the incidence in the low-risk group. This represents the
incidence in the high-risk group that can be attributed to the variable under study. That is, this is the rate of persons
in the high-risk group who developed the disease who would not have done so had it not been for the variable under study.
This gives us a measure of the amount of disease in the high-risk group that could be eliminated if that risk factor were
eliminated.
Individually Randomized Controlled Trials
In the classic model of the randomized controlled trial, subjects are individually assigned to experimental and control
groups. Although the degree of randomization varies, the following examples all illustrate individual assignment to groups.
An Early Experiment on the Treatment of Scurvy
Throughout human history various persons living on a diet deficient in fruits and fresh vegetables—such as sailors
on long voyages—have suffered from the disease known as scurvy. Persons with scurvy first experience a loss of energy
and pains in their legs, arms, and joints. As the condition progresses it produces symptoms of great weakness; spongy, bleeding
gums; loosening of teeth; very bad breath; hemorrhages from the mucous membranes and under the skin; anemia; and painful hardening
(known as brawny indurations) of areas in the muscles. The disease was frequently fatal.
In the mid-18th century, a number of theories were current about the cause and cure of scurvy. The British Naval physician
James Lind (1753) performed a simple small scale experiment aboard HMS Salis¬bury in 1747 to test the rival treatments. He
took aboard his ship 12 scurvy victims whose "cases were as similar as I could have them". The 12 men were housed together
and fed the same diet. Six different treatments were tried on two men each. The selection of who was to receive each treatment
was apparently a matter of chance, with the exception that two sailors, who seemed a bit sicker than the rest, were assigned
to receive treatment with salt water—apparently the treat¬ment in which Lind placed the most faith.
At the end of 6 days it was apparent that the two men whose treatment consisted of being given two oranges and one lemon
to eat each day were showing the greatest improvement. One of the two, in fact, was fit to return to duty on the 6th day.
The other 10 patients were likewise put on the citrus treatment and recovered. Based on these results, Lind recommended that
all seamen should receive fruit daily to prevent scurvy. It took the British Navy only 50 years to adopt this recommendation,
leading to the nickname "limey" for a British seaman.
An Experiment in Preventive Medicine for Heart Disease
The Multiple Risk Factor Intervention Trial (MRFIT) tested the effectiveness of multiple risk factor intervention conducted
by physicians for men at high risk of ischemic heart disease. The study sample was identified by conducting screening programs
in 20 U.S. communities over a 2-year period from 1973-1975. Over 370,000 men were examined and 12,866 subjects were identified
who met the criteria of being currently free from symptoms of heart disease but being at high risk of heart disease due to
cigarette smoking, high blood pressure, and elevated serum cholesterol.
Subjects were randomly assigned to either a special intervention (experimental) group or a usual care (control) group.
The special intervention group was put on stepped-care drug treatment for their hypertension and was counseled on smoking
cessation and dietary modification. The intervention began with a series of 10 weekly one to two-hour intensive group sessions
for the subjects and their wives. The purpose of these sessions was to provide information about the risk factors for heart
disease and to initiate behavior change programs utilizing methods from behavior modification and group dynamics. Additional
individual counseling was available for subjects who were not making progress toward their risk factor modification goals
by the end of the initial 10 weeks.
Over an average follow-up period of 7 years, the mean risk factor levels for both groups were reduced. The experimental
group, however, showed the greatest reductions in all three risk factors—smoking, blood pressure, and serum cholesterol.
The heart disease mortality rate for the experimental group was 17.9 deaths per 1,000 while that for the control group
was 19.3 deaths per 1,000. This represents a statistically nonsignificant difference. Relative and attributable risk should
not be calculated in such a case because the significance test indicates that the difference found is probably due to chance.
Total mortality rates for the two groups were 41.2 deaths per 1,000 for the experimental group and 40.4 deaths per 1,000 for
the control group. These rates also are not significantly different. The MRFIT results must, therefore, be interpreted as
showing that the special intervention program had no more effect than ordinary care on the subsequent mortality of men at
high risk for heart disease.
It should be clearly noted that the MRFIT only failed to support the value of the special intervention tested; it did not
demonstrate that risk factor change was ineffective. Men in both groups who quit smoking experienced significantly lower heart
disease mortality and total mortality than those men in either group who did not quit smoking. This evidence, of course, is
not experimental in nature—quitting and not quitting were not randomly assigned so as to test their effects experimentally.
Community Experiments
Often the independent variables that are of interest to epidemiologists are not of such a nature that they can be applied
to individuals. We cannot, for instance, provide some individuals in a community with clean air to breathe while other randomly
selected individuals breathe polluted air.' b test the impact of community-wide variables we must conduct RCTs in which communities
are randomly assigned to serve as experimental or control groups.
Community RCTs also increase the generalizability (or external validity) of research findings. Conducting trials in natural
communities rather than laboratories or other contrived settings, which may be used in individually randomized RCTs, allows
us to be more certain that the results of these studies will be applicable to the "real world." They do, however, present
a number of statistical (Cornfield, 1978; Sherwin, 1978) and logistical (Farquhar, 1978) problems.
The Newburgh-Kingston Study
One of the classic community trials was the 10-year study of water fluoridation designed by David Ast (Ast & Schlesinger,
1956). Place studies had demonstrated that persons raised in areas where the water supply was naturally high in fluoride experienced
about 60 percent less tooth decay (dental caries) than persons raised in areas with low fluoride levels in the water supply.
The proposal to raise the fluoride level of public water supplies artificially had met with considerable controversy. Some
argued that such a measure would not be effective, others that it would not be safe (Ast & Schlesinger, 1956). The U.S. Public
Health Service and much of the dental profession had endorsed dentist-applied fluoride treatments in preference to water fluoridation.
Ast was apparently among the opponents of fluoridation and expected his study to put an end to the idea of water fluoridation.
The two communities participating in this study were the cities of Newburgh and Kingston in New York. Located about 35
miles apart in the Hudson River valley, each city had a population of about 30,000 and similar ethnic and socioeconomic makeups.
By the flip of a coin it was decided that Newburgh would serve as the experimental community and have its water supplemented
with enough sodium fluoride to raise its fluoride level from 0.1 parts per million (ppm) to between 1.1 and 1.2 ppm. Kingston
would serve as the control community with its fluo¬ride level remaining unchanged at 0.1 ppm.
Prior to the fluoridation of the Newburgh water supply, extensive dental and medical examinations were conducted on 1,628
school children in Newburgh and 2,140 in Kingston. Periodic reexaminations were conducted throughout the 10-year study. Vital
statistics regarding crude mortality, infant mortality, maternal mortality, cancer mortality, and so on were also monitored
for both communities. Within a few years, the preliminary results had reversed Ast's position on the water fluoridation issue.
The baseline data had shown that there was no significant difference between the rates of dental caries in the two communities.
Children aged 6-12 in Newburgh had a rate of 20.6 decayed, filled, or missing (DMF) teeth per 100 permanent teeth. In Kingston
the rate was 20.2 DMF teeth per 100 permanent teeth. Over the 10 years of the study, the rate in Kingston remained essentially
unchanged while that in Newburgh steadily declined to less than half the baseline rate.
Newburgh children aged 6-9, having drunk fluoridated water all their lives, had 57.9 percent fewer DMF teeth than children
the same age in Kingston. Even 16-year-old Newburgh children, whose permanent teeth were already largely formed when water
fluoridation began, showed 40.9 percent fewer DMF teeth than 16-year-olds drinking the nonfluoridated water in Kingston.
In terms of relative risk, it can be said that the lack of water fluoridation caused the 6- to 9-year-old children in Kingston
to suffer 2.37 times as much tooth decay as they would have if their water had been fluoridated. In terms of attributable
risk, this amounts to about 10 decayed, filled, or missing teeth per 100 erupted permanent teeth.
The extensive medical examinations conducted on children in both communities failed to detect any effects of fluoridation.
This included careful measures of growth and of bone density and maturation. Also included were tests of vision and hearing.
Blood and urine analyses showed slightly more favorable results for children from Newburgh but no medically significant differences.
Vital statistics revealed no effects on mortality in any age group or due to any cause. In brief, this and other similar experiments
have shown that water fluoridation is both highly effective and quite safe.
The Stanford Three-Community Study
Another classic community RCT is the Stanford Heart Disease Prevention Project (Maccoby, Farquhar, Wood, & Alexander, 1977).
This RCT tested the effectiveness of community health education as a means of reducing risk factors for heart disease and
stroke.
Three communities in northern California served as the sites for the study. All three communities were within 60 miles
of the researchers' base at Stanford University. Two of the communities, Watsonville and Gilroy, were served by the same television
station but were separated by a small range of mountains, which minimized interaction despite their proximity. The third community,
Tracy, was on the opposite side of Stanford and outside the range of the television station serving the other two communities.
The communities were much alike in terms of population and economic factors.
Geography rather than randomization dictated that Tracy would be the control community, while Watsonville and Gilroy with
their shared television station would be the targets of mass media messages about heart disease prevention. In addition to
the use of television and radio messages, billboards, newspaper columns and advertisements, and mailed printed material in
both experimental communities, two-thirds of a group of high-risk subjects in Watsonville were offered inten¬sive counseling
and follow-up services. The intensive services in Watsonville were offered to a randomly selected subgroup of high-risk individuals,
which constitutes an embedded individual assignment RCT within the larger community study.
Pre and post surveys in the three communities showed 26 percent and 41 percent increases in knowledge of risk factor effects
in the two experimental communities, with no increase in the control community. The group in Watsonville receiving the intensive
intervention showed a 54 percent increase in knowledge.
Average levels of saturated fat consumption were reduced by approx¬imately 25 percent in both experimental communities;
serum choles¬terol was reduced by 2-4 percent; cigarette smoking by 5-20 percent; and systolic blood pressure by 5-10 mm Hg.
In Tracy, risk factors increased slightly.
Risk factor scores for a random sample of the population from each community showed an average decrease of 16 percent in
Gilroy and 20 percent in Watsonville, with a 6 percent increase in Tracy. Looking only at high-risk individuals, those in
Tracy showed a risk factor score reduction averaging less than 5 percent while those in Gilroy and Watsonville showed a reduction
of 25 percent. The inten¬sive intervention group in Watsonville reduced their risk factor scores an average of 30 percent.
A subsequent study known as the Stanford Five Community Study was conducted with two treatment and three control communities
(Farquhar et al., 1985). In addition to improvements in the intervention methods and a more sophisticated sampling design,
this 7-year study extended its outcome assessments to include incidence measures.
Natural Experiments
On rare occasions, circumstances may arise in which a variable of possible causal importance is distributed in a population
in a way that approximates random assignment. In these instances, differences be¬tween those exposed to the variable and those
unexposed may be compared as though they were differences between an experimental group and a control group. These fortuitous
occasions are known as "natural experiments."
A Natural Experiment on Cholera
John Snow (1855) was able to test his hypothesis that cholera was spread through fecal contamination of water in a natural
experiment during the 1853 cholera epidemic. At this time a number of different companies competed selling water to the citizens
of London. In the south of London many neighborhoods had their choice of water from either the Southwark & Vauxhall Company
or the Lambeth Company. The pipes of the two companies passed together down all the streets of several south London districts.
Some homeowners bought from one company, others from the other. Houses side-by-side might get their water from two different
suppliers. In many cases, the choice had not been made by the current homeowner but by a previous owner.
Before 1852. it made little difference which water company served a house -- both drew their water from highly contaminated
parts of the Thames River. In 1852, however, the Lambeth Company moved their waterworks to a position upstream from the London
sewers. From this time forward they provided water relatively free from fecal con¬tamination while that from the Southwark
& Vauxhall Company continued to be heavily contaminated.
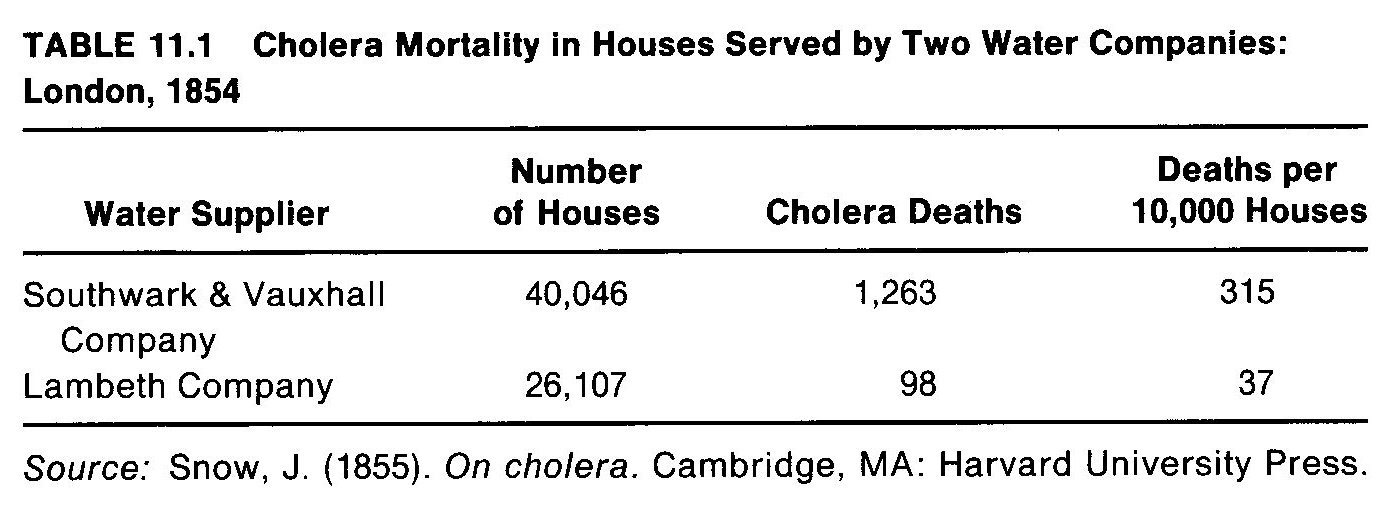
During the 1853 cholera epidemic, Snow identified the deaths that occurred in houses served by each of these companies.
Because he had no way of readily knowing the number of persons served by each company, he calculated rates based on deaths
per 10,000 houses. He found that there were 315 deaths for every 10,000 houses served by Southwark & Vauxhall but only 37
deaths per 10,000 houses served by the Lambeth Company (Table 11.1).
From these results it can be seen that cholera deaths were 8.5 times more likely to occur in houses served by the Southwark
& Vauxhall Company than those served by the Lambeth Company. In terms of attributable risk, 278 deaths occurred per 10,000
houses served by the Southwark & Vauxhall Company because they were served by that company instead of Lambeth.
The Vietnam Veteran Study
During the last years of the Vietnam War, a great deal of public concern was focused on drug use (especially heroin use)
by U.S. servicemen in Vietnam. There was concern that such drug use was impairing their ability to fight. There was even greater
concern about the impact on American society when drug addicted veterans returned from Vietnam. Lee Robins (1978) conducted
an important study that addressed this problem.
A group of Vietnam veterans was identified, which consisted of a random sample of all Army enlisted males who returned
from Vietnam in September of 1971. A control group was selected from the records of the Selective Service System; the members
of this cohort were young men who were eligible for the draft but who held high lottery numbers and therefore had not been
drafted. Members of the second group were individually matched with members of the veteran group on the basis of age, educational
level, and place of residence at the time the veteran was inducted. Because lottery numbers were essentially random, these
two groups -- draftees with low lottery numbers and non-draftees with high lottery numbers -- are essentially equivalent to
randomly assigned groups. This is not quite true, of course, because the veteran group included a minority of volunteers who
might be different from draftees.
Both groups were interviewed about 1 year and about 3 years after the veterans' return from Vietnam. Each veteran was interviewed
concerning his drug use before induction, while in the Army, and since discharge. Non-veterans were asked about their drug
use during the period matching those phases in the life of the veteran they were matched with.
As expected, the Vietnam veteran group showed much higher incidence rates for first use of marijuana and narcotics during
their military service than did the non-veterans during the same period. However, an unexpected finding was that the veterans
showed higher incidence rates than the non-veterans in all three time periods for marijuana, narcotics, barbiturates, and
amphetamines. This was truer for the volunteers than for the draftees, but the draftees still showed higher incidence rates
than their matched controls even before they were drafted.
Although the incidence rates for the two groups differed over all three time periods for all four drug groups, the curves
were essentially the same for both groups for barbiturates and amphetamines—the veterans' incidence rates paralleling
those of the non-veterans at a somewhat higher level. Both groups showed highest incidence during the second period and lowest
during the third, indicating that the veterans had served in Vietnam during the period when they would have been at highest
risk of drug use initiation in any case. For marijuana and narcotics the same pattern appears but the increase during the
second period for the veterans is far greater than for the non-veterans. In summation, it appears that soldiers serving in
Vietnam were at an age when they were most vulnerable to the initiation of illicit drug use and they therefore were greatly
affected by the availability of marijuana, opium, and heroin in Vietnam and by the circumstances of combat service to initiate
use of these drugs at an exceptionally high rate.
Recommended Reading
Bulpitt, C. J. (1983). Randomized Controlled Clinical Trials. The Hague, Netherlands: Martinus Nijhoff Publishers.
Mattson. M. E., Curb. J. D.. & McArdle, R. (1985). Participation in a clinical trial: The patients' point of view. Controlled
Clinical Trials, 6,156-167.
Pocock. S. (1984). Clinical Trials: A Practical Approach. New York: John Wiley & Sons.
Snow, J. (1936). Snow on Cholera. New York: The Commonwealth Fund. Reprint of the 1855 first edition.
Symposium on CHD Prevention Trials: Design issues in testing lifestyle intervention. (197B). American Journal of Epidemiology,
108, 85-111.
|